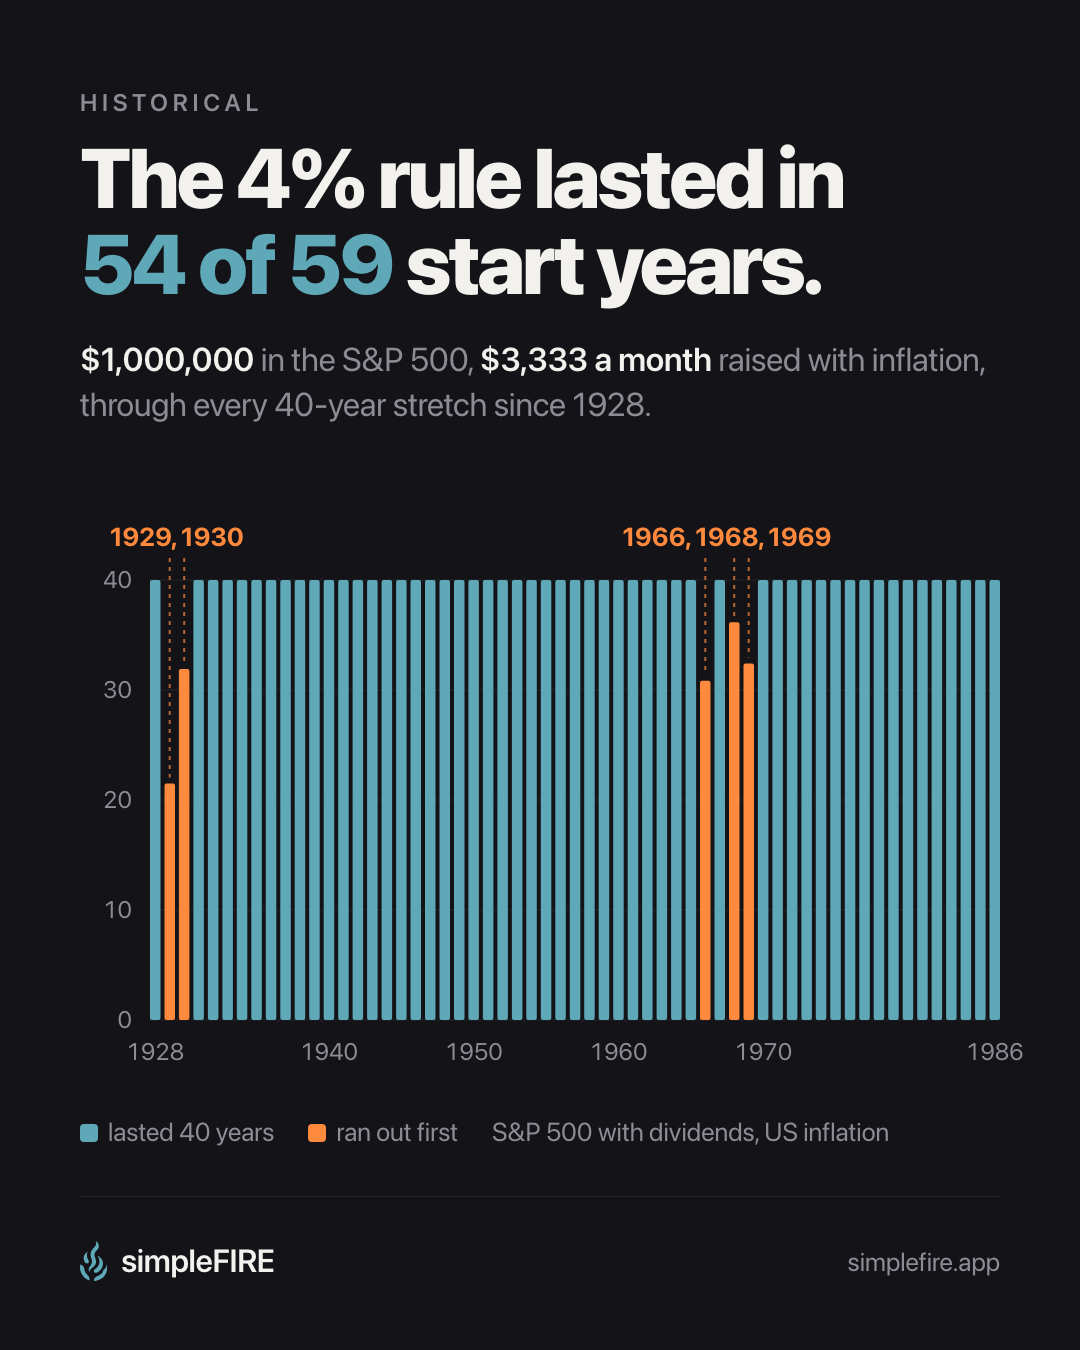
 The 4% rule, tested on 59 start years.
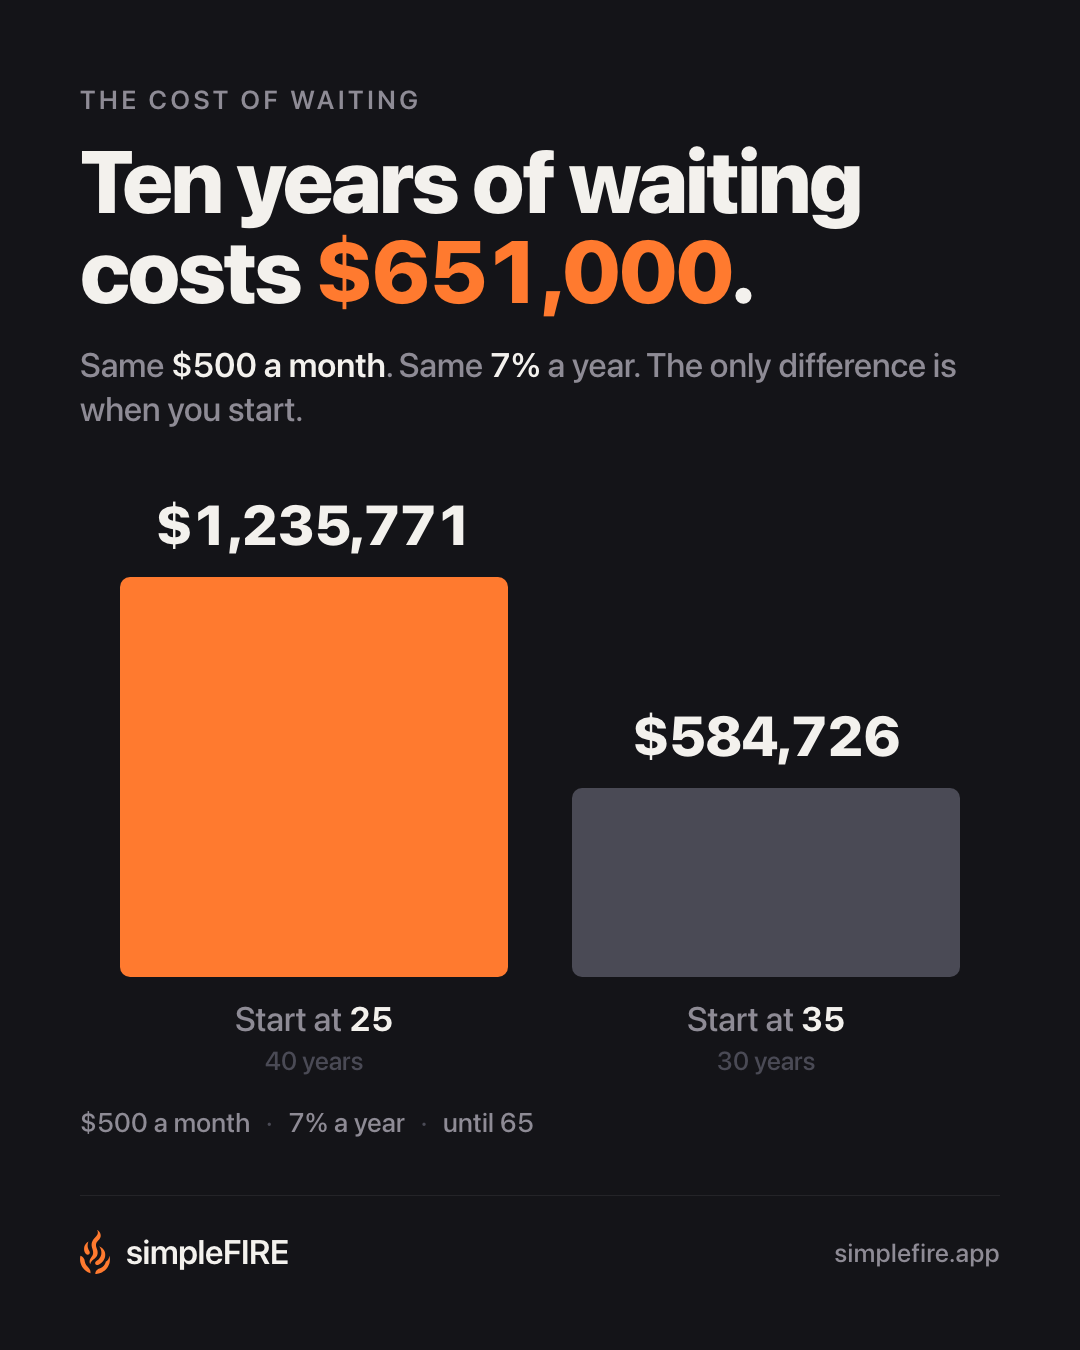 Ten years of waiting costs $651,000.
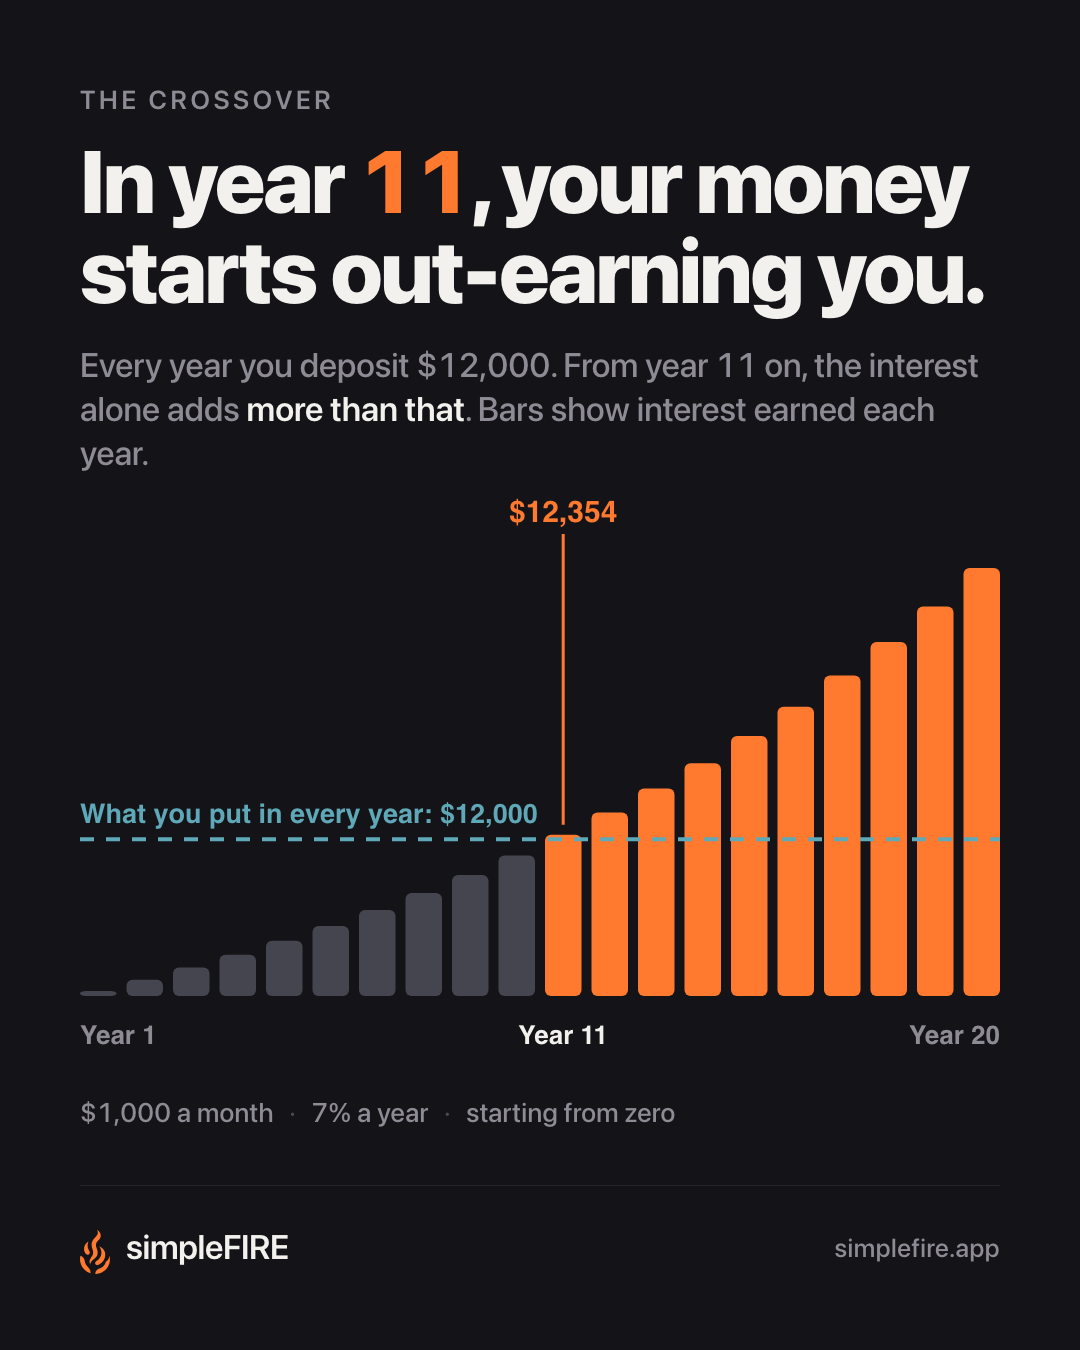 In year 11, your money starts out-earning you.
2.3.1
October 8, 2026
- Rate simpleFIRE in one tap: a new row in the app's settings opens the App Store review page. Every review helps other FIRE planners find the app.
Move the sliders and watch a portfolio compound year by year, with contributions and interest side by side. Every number updates as you go, the full chart and table sit right below, and any calculation is one link away from a friend.
| This year | So far | |
|---|---|---|
| Start | · | |
| Contributions | ||
| Interest |
Tap or drag across the chart to pick a year.
| Year | Portfolio | Contributions | Interest |
|---|
Assumptions: annual compounding, deposits at the end of each month, no inflation, passive income at a 4% withdrawal rate. The same defaults as the app.
The calculator above is one of three in simpleFIRE. The app adds the two questions that come next, when you reach your target and how long the money lasts once you live off it, tests every plan with Monte Carlo or against real market history, and then shows every number behind the answer: the chart you tap through year by year, the table, the assumptions.
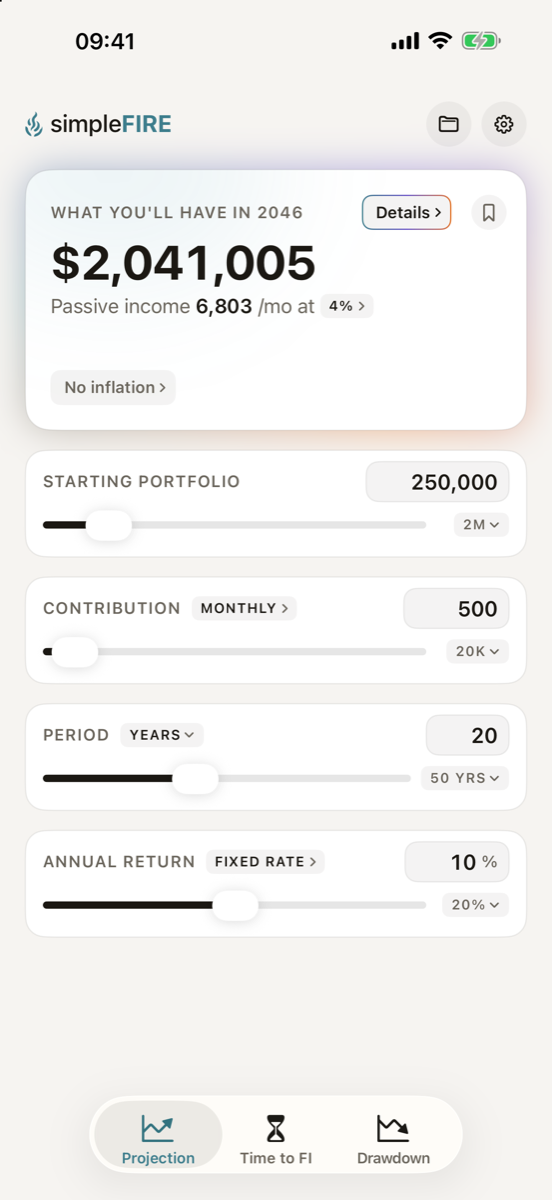
Starting portfolio, monthly contribution, period and annual return. Watch the portfolio compound year by year, with your contributions and the interest they earned side by side.
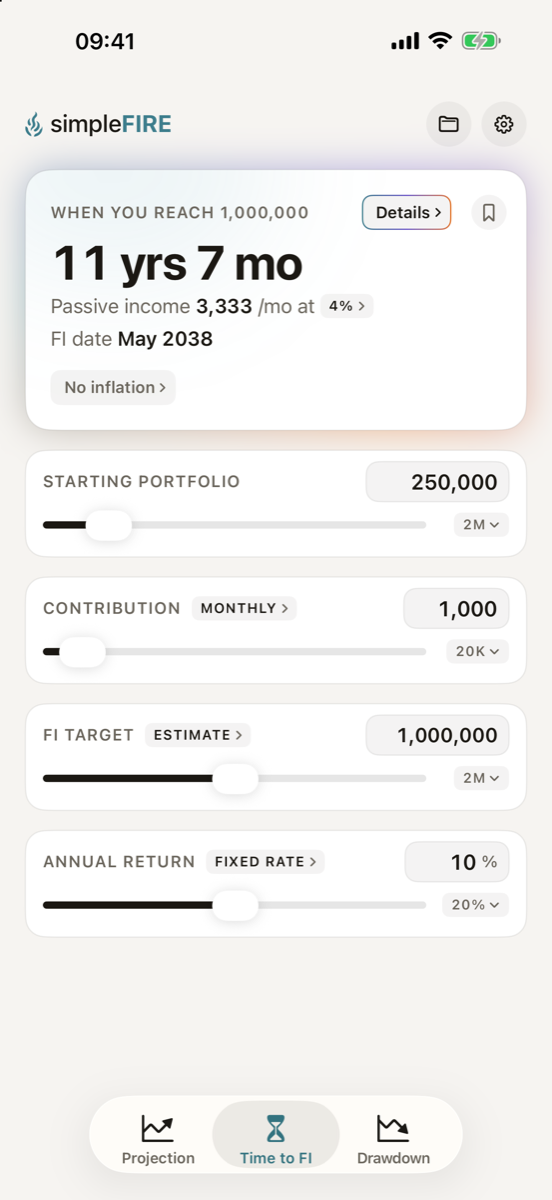
Set your FI target and see the year and month you reach it, the passive income it pays, and how far along you are each year. Not sure of your number? The app estimates it from what you spend.
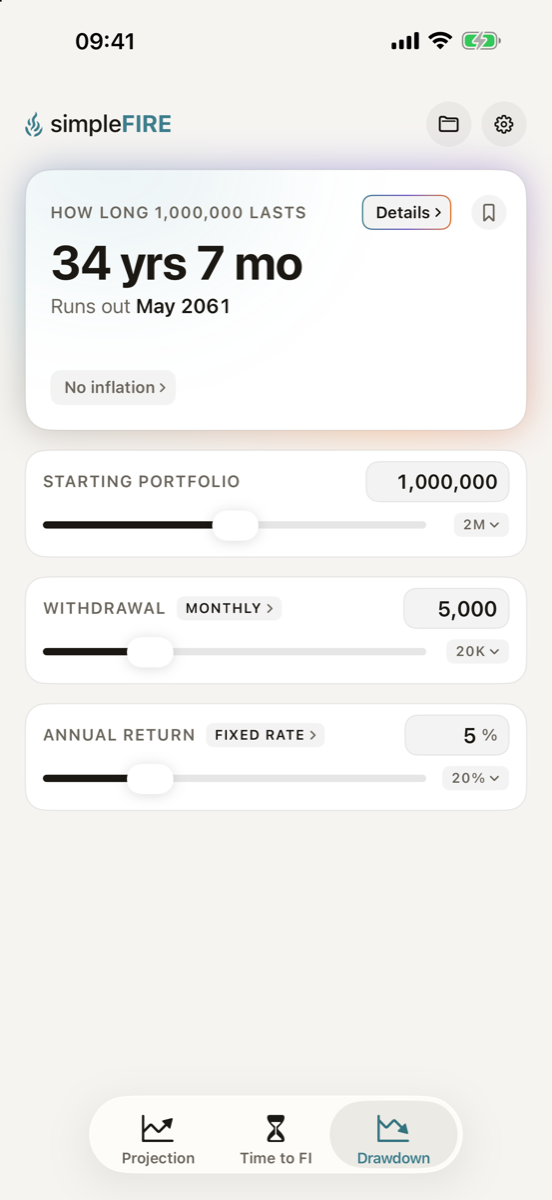
Start taking money out. See the year and month the portfolio runs dry, how much you withdraw along the way, and whether the returns outrun your withdrawals.
Markets never pay the same return twice. Switch any of the three calculators to Monte Carlo and the app runs 5,000 simulations of your exact plan, updated live as you move a slider. Prefer real data? Historical backtests your plan the way the Trinity study tested the 4% rule: through every period of real S&P 500 and US Treasury returns, with the inflation each year actually brought. Or keep it simple with a fixed rate. Set your mix of stocks and bonds with one slider and read every answer as a plain chance.
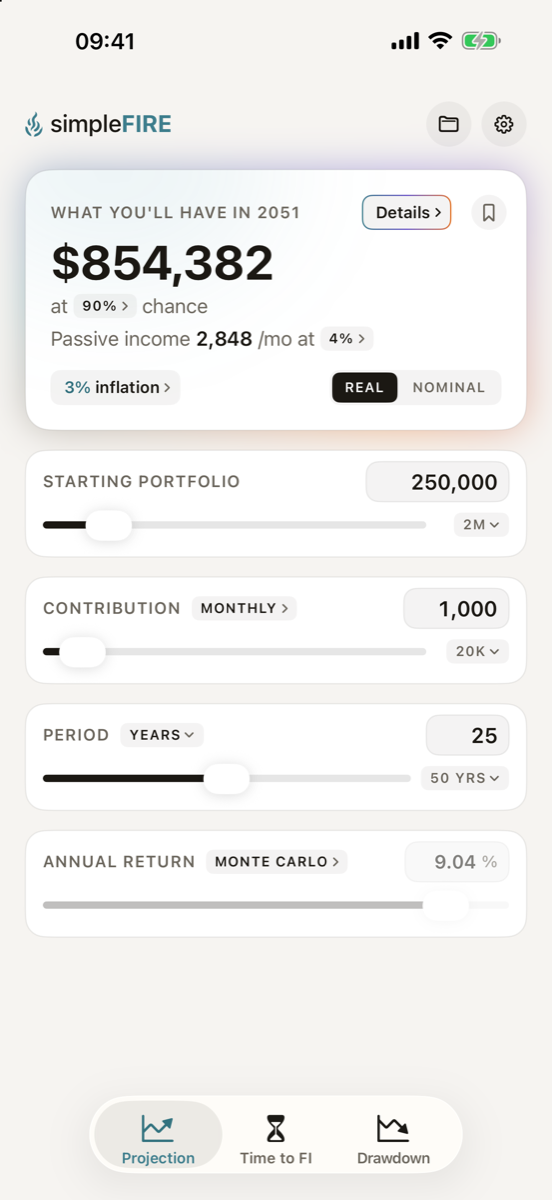
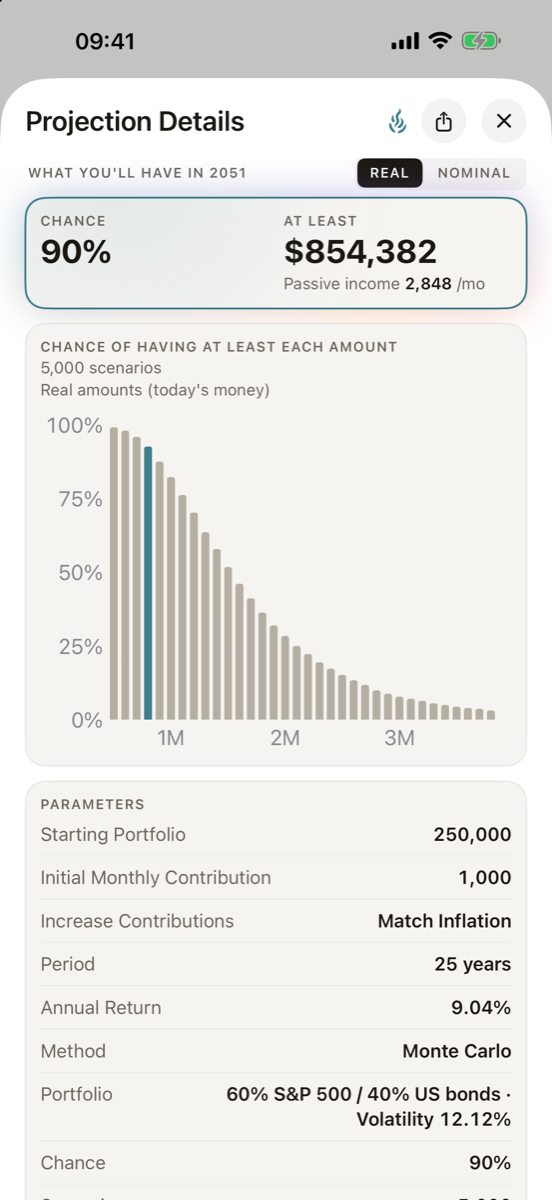
Monte Carlo: the portfolio you have with a 90% chance, and the chance of having at least each amount.
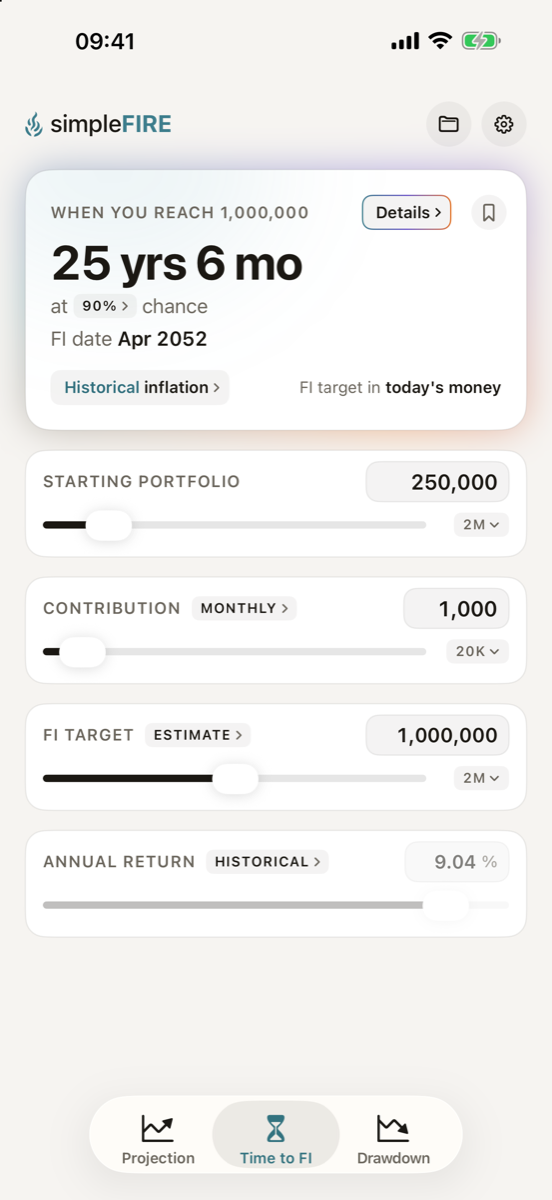
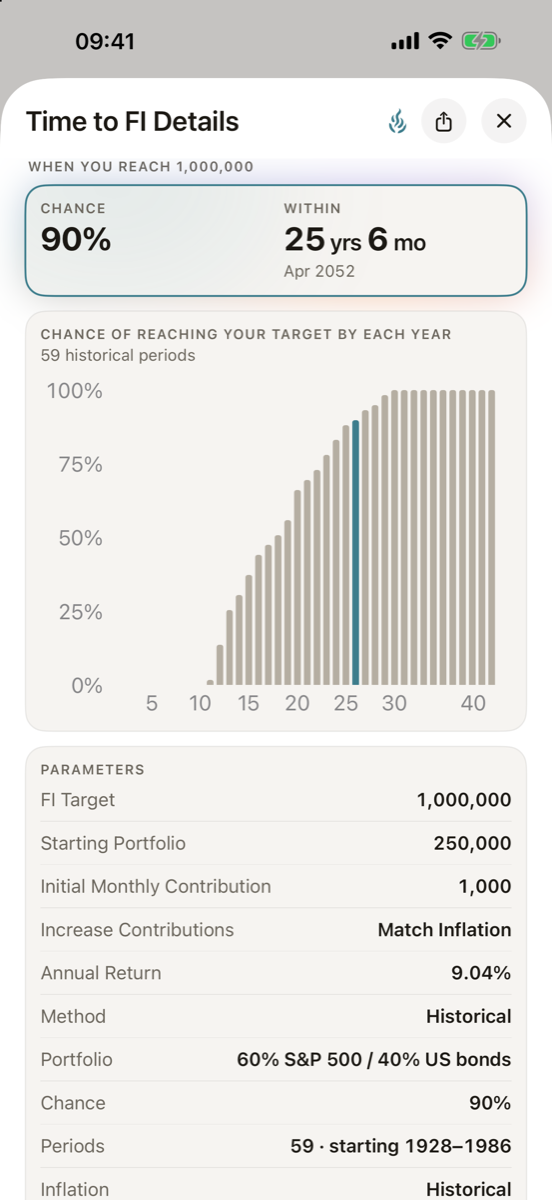
Historical: when you reach your target with a 90% chance, and the chance of getting there by each year.
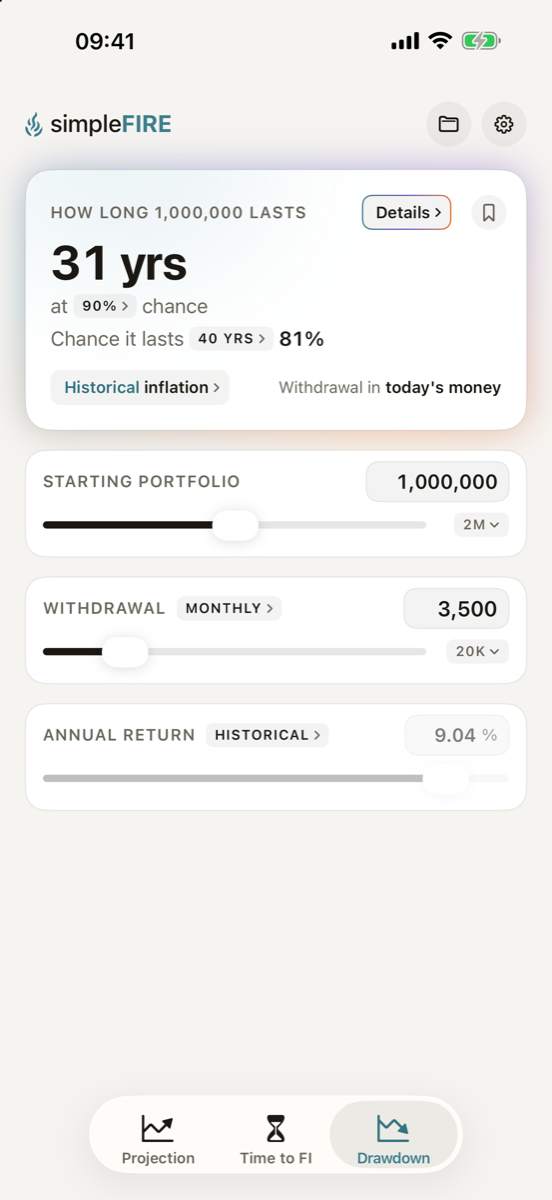
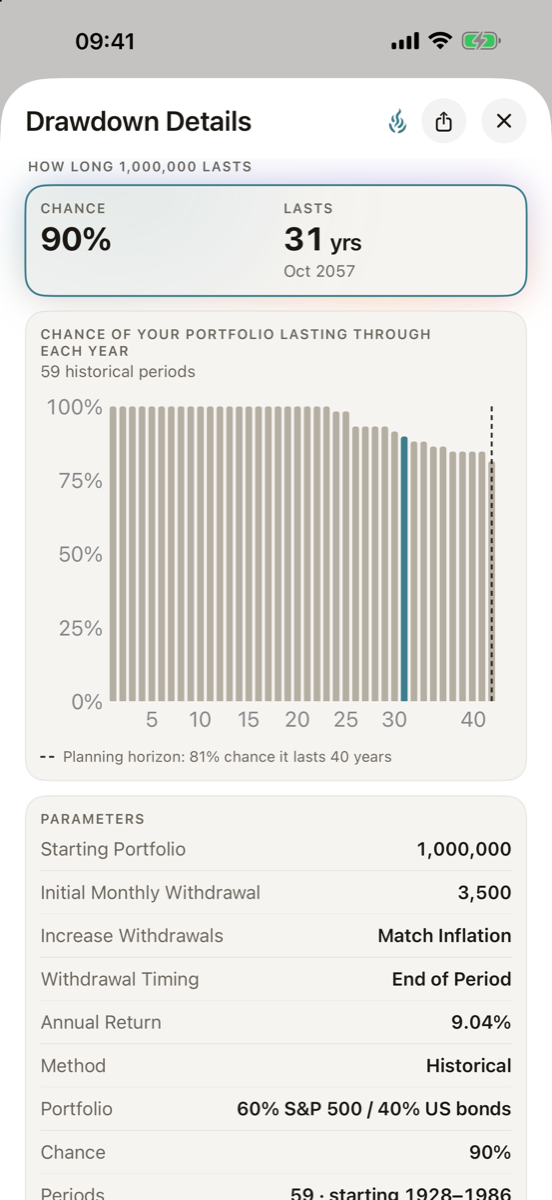
Historical: how long your money lasts with a 90% chance, and the chance it lasts through your planning horizon.
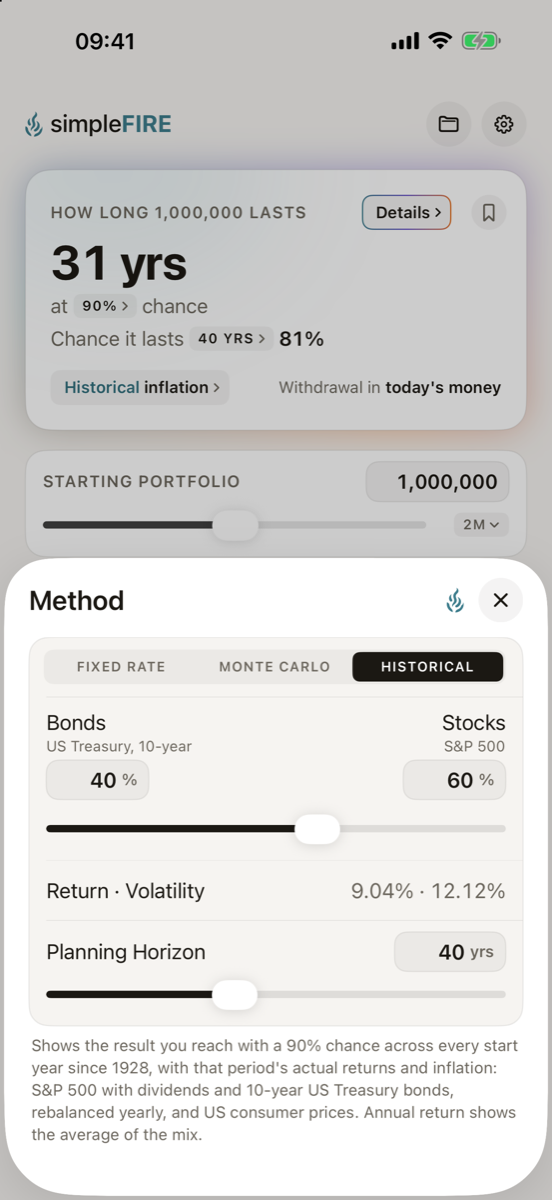
Fixed rate, Monte Carlo or Historical, and one slider for S&P 500 stocks and US Treasury bonds.
The result is one tap from the year-by-year story behind it, and every assumption is a slider you can see and change.
Drag a finger across the chart and the result above it follows, year by year. Let go and it returns to your answer.
Inflation is one tap away on every calculator. Flip any result between what it buys today and what your account will show, while your FI target and your withdrawals keep up with prices.
A clean one-page report with the chart, the assumptions and the yearly table, or an image made for messages and social media.
Keep several plans, a cautious one and a bold one, and switch between them in a tap.
Compounding, contribution timing and yearly increases, withdrawal timing and rate, planning horizon, your stocks and bonds mix, the chance you plan with: every setting sits next to the result it changes, every result lists the ones it depends on, and the About page explains how every number is calculated.
The year interest overtakes your deposits, the line of your FI target, the year the money runs out: marked where they happen. With Monte Carlo and Historical, the chance of your plan working, bar by bar.
Two themes, your currency and number format, text that follows your accessibility settings.
One app across all your Apple devices, with Split View and Slide Over on iPad.
No account, no sign-in, no tracking. Your numbers never leave your device. Privacy policy.